|
|
|
|
中文版 | News | Archives | Reviews | Forum | $ Deals | Links | History | Contact | Privacy |
|
| ||||
Seagate SATA Barracuda ATA V (4)
Benchmarking Our test environment :
We will be running 4 popular HD benchmarking programs on the two drives.
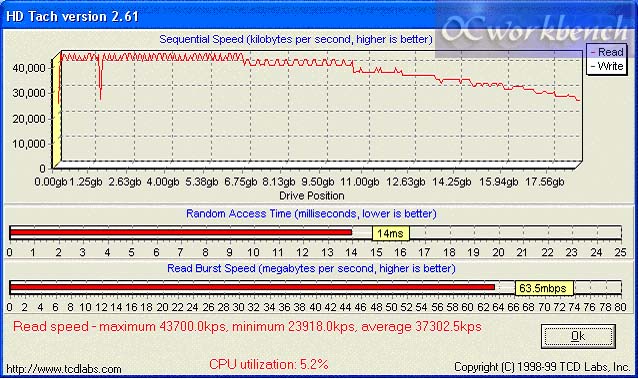
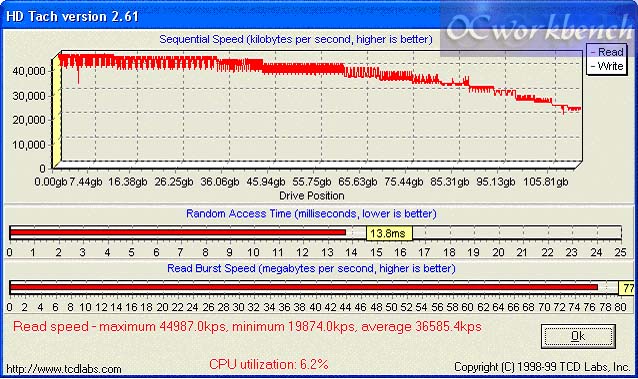
HD-Tach 2.61 HD-Tach measures the throughput from the outer to the inner ring of the HD. Although real applications don't read/write in a sequential manner, this benchmark does give us some indications on the HD's parameters. First of all, it is the Random Access time of 14ms on the ST32100A and a faster 13.8ms. Both HD are running on 7200RPM and basically have similar access time. (take note access time = rotational latency + seek time (< 9ms), thus 14 ms = 4.15ms + seek time and this will give you a seek time of 9.85ms on the ST32100A. Quoted from HD-Tach website : "Random access is the true measure of seek speed. Many drives advertise sub 10 millisecond seek speeds, but seek speeds are misleading. Access time is the time it really takes to read data, not just the time it takes to move the head to the proper cylinder. To calculate access time the software must read a single sector off of the hard drive. By reading a sector the drive can not respond to the command until the sector is available, so rotational latency + seek time = access time. A 7200 rpm drive has a rotational latency of 4.15 ms on average. A 4500 rpm drive has a rotational latency of 6.67 ms on average. So a 7200 rpm drive with a seek of 12.5ms has an access time that is just as fast as a 4500 rpm drive with a seek of 10.0 ms. " In both figures, there is the Read Burst Speed. The ST32100A IDE drive recorded 63.5mbps while the SATA records 77mbps. Well, this difference could be due to the larger 8MB cache. Another interesting observation from the charts is that the SATA has less sawtooths and dips compared to the IDE equivalent drive. CPU utilisation seems to be slightly higher on SATA drive.
Fig 1 : IDE HD ST32100A
Fig 2 : SATA HD ST320029AS |
|
(C) Copyright 1998-2009 OCWorkbench.com
|